How Roman Egyptian Scribes Used Diagrams to Solve Mathematical Problems!
For scribes working in Roman Egypt, a simple drawing could be an essential part of solving a mathematical problem. When calculating the area of a field or determining the dimensions of a structure, they often sketched geometric shapes onto papyrus and added numerical values to illustrate their calculations. A new study has examined these diagrams in detail, revealing how they helped scribes work through problems, remember important figures and check their answers.
The research was conducted by Thomas Kelly, a classicist at the University of Cambridge, who compiled the first comprehensive catalogue of mathematical diagrams preserved on Greek papyri from Roman Egypt. His study examines ten documents dating from the first to the fourth century CE, each containing geometry problems accompanied by drawings. While some papyri contain just one problem, another preserves 38. The research has been published in Historia Mathematica.
Until now, these diagrams had not been brought together in a single catalogue. The documents are held in different collections, and previous editors did not always reproduce or describe the illustrations consistently. Kelly redrew each diagram and recorded its features, allowing him to investigate how scribes used these visual aids.
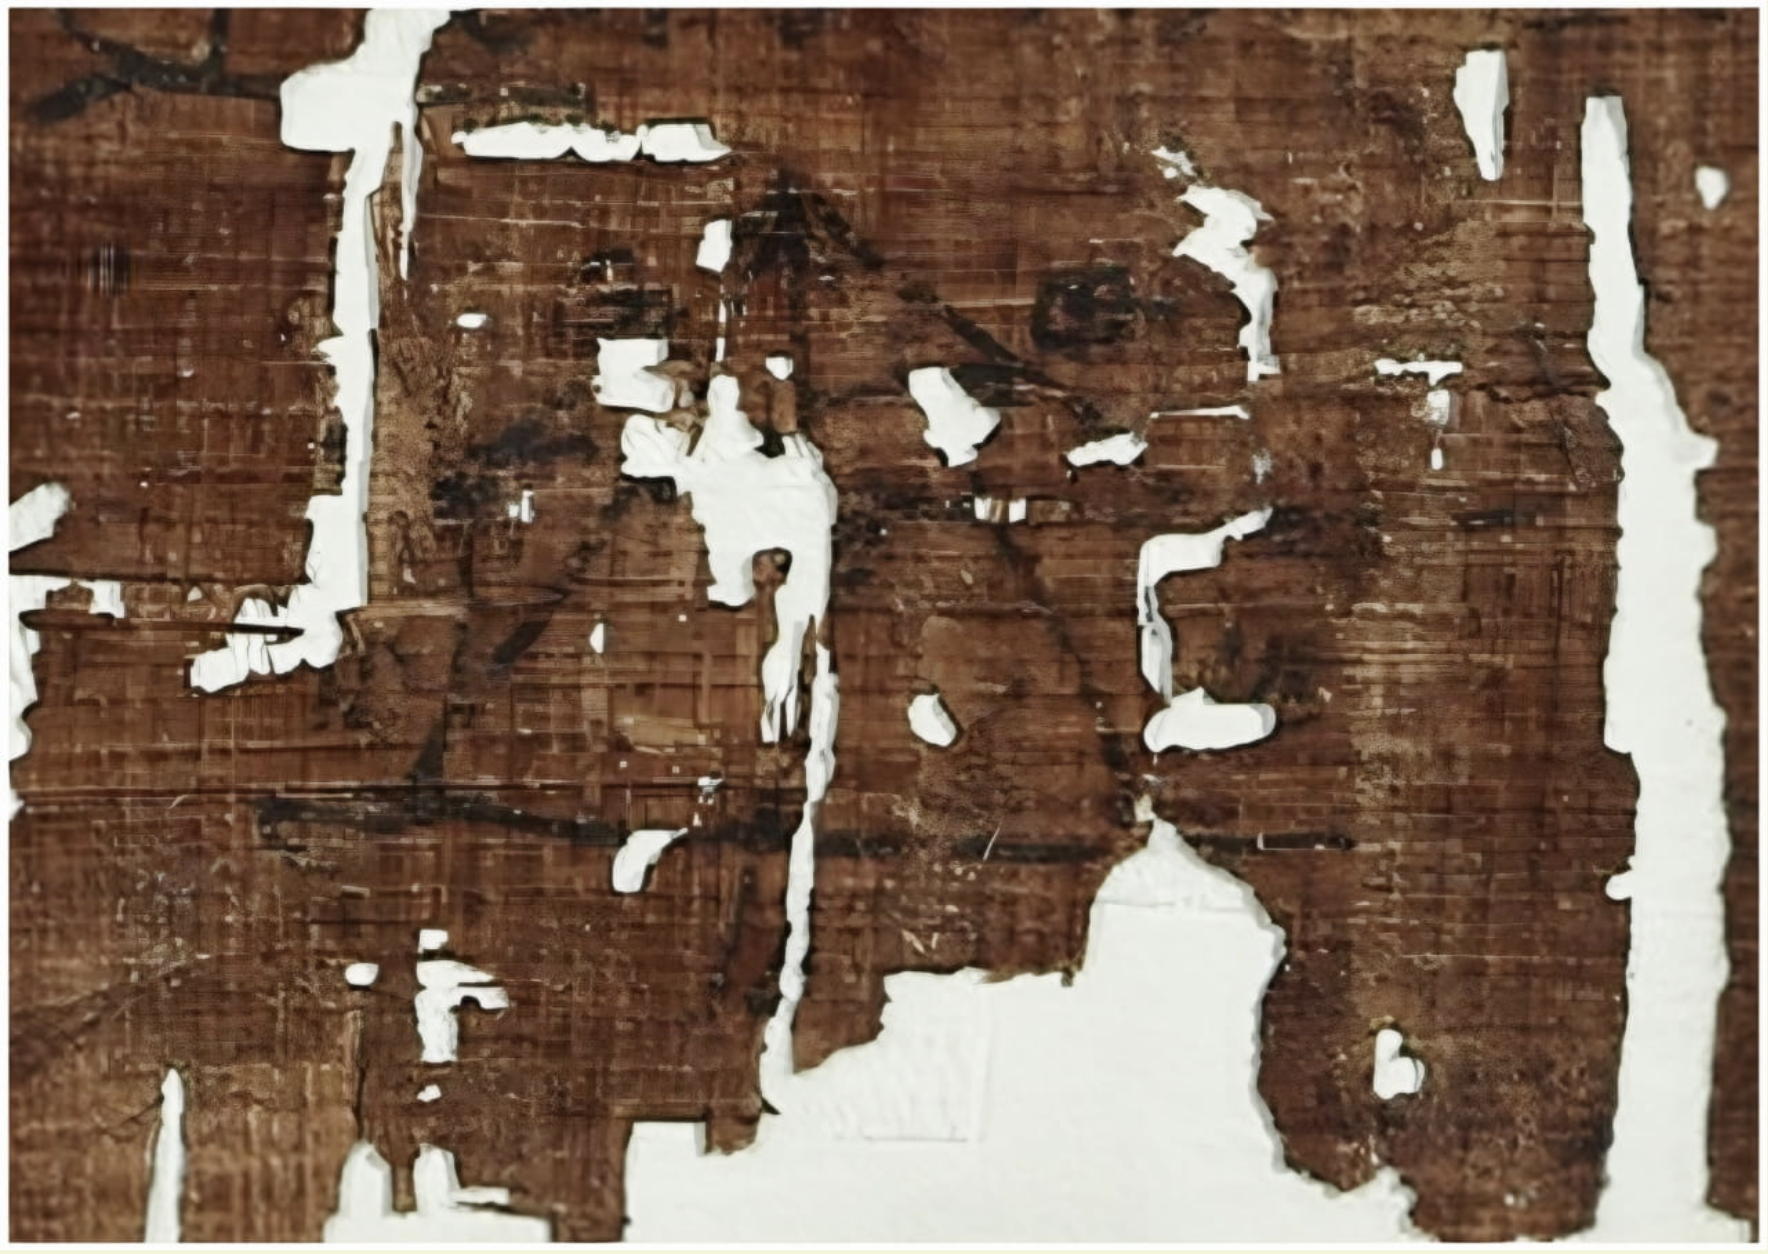
Photo Credit: Kelly, T., Historia Mathematica (2026)
The mathematical exercises frequently concern practical matters, including land measurement, excavation work and grain storage. Their instructions often resemble a set of straightforward steps that the reader must follow to reach an answer.
One example describes a semicircle with a leg measuring five schoinia and a diameter of ten. The instructions tell the reader to add the two measurements, divide the total by two and multiply the result by five. This produces an area of 37.5 arourai. Both schoinia and arourai were units associated with land measurement, demonstrating the practical context behind these calculations.
A drawing of the semicircle accompanies the instructions, providing a visual representation of the problem rather than leaving the reader to rely entirely on the written explanation.
Although these drawings served a practical purpose, they were rarely precise works of geometry. Papyrus fibres could make it difficult to draw straight lines, while reed pens did not always hold enough ink to produce an uninterrupted mark. Some diagrams show evidence of scribes going over their lines repeatedly, and circles often appear irregular because compasses were not used.
There were also recognisable conventions in how particular shapes were drawn. Right-angled triangles, for example, frequently follow a similar pattern, with the right angle positioned in the bottom-left corner and the base extending further than the height.
This consistency did not necessarily reflect the actual measurements in the accompanying problem. In one example, a triangle has a base of seven and a height of nine, yet the drawing is considerably wider than it is tall. Kelly suggests that scribes prioritised familiar, easily recognisable shapes over accurate proportions. Standardised drawings may also have saved valuable space on the papyrus.
The placement of numbers followed similar conventions. Measurements provided in the question generally appeared outside the shape, while calculated areas and final answers were written inside the diagram or to its right. This created a predictable arrangement that helped readers distinguish between the information they started with and the results they obtained.
Some scribes also included additional figures that were not immediately necessary to solve the problem. A fourth-century teaching codex known as P. Math contains a triangle with the squares of two sides recorded beside them. One of these values, 225, would only become relevant during a later stage of the calculation.
Rather than being meaningless additions, these numbers may have acted as memory aids. By recording intermediate calculations directly on the page, scribes could keep track of their work without having to remember every figure as they progressed.
In some cases, the diagrams did considerably more than illustrate the accompanying text. Certain problems cannot be fully understood without examining the drawings themselves.
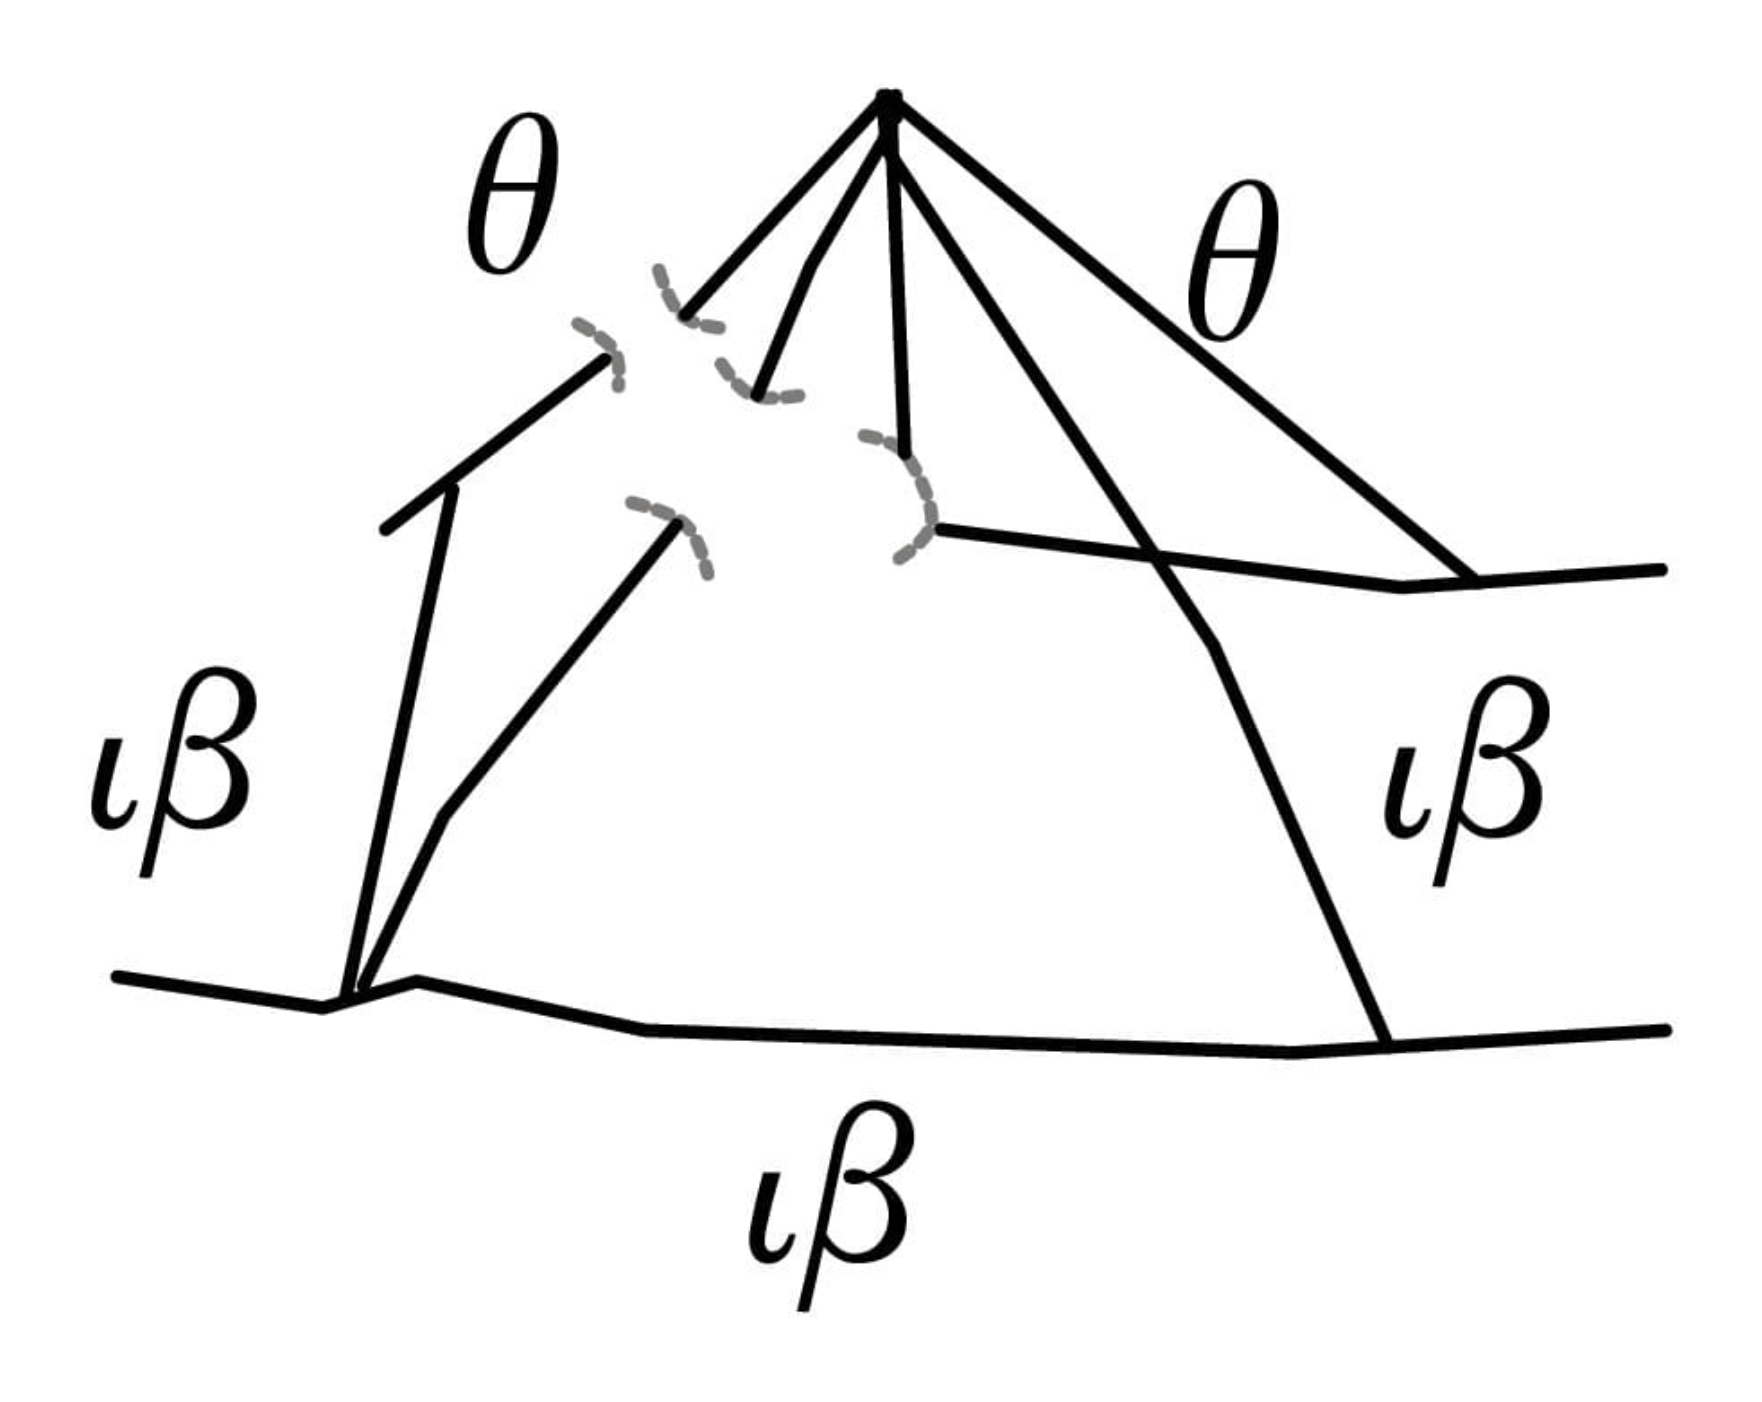
Photo Credit: Kelly, T., Historia Mathematica (2026)
A papyrus from Chicago, for instance, contains a problem without measurements in the written instructions. The necessary numerical information must instead be obtained from its diagram. Another document, P. Bagnall 35, places a drawing between the problem and its solution. The text refers to directions such as north and west, making the accompanying illustration essential for understanding how the calculation should proceed.
These examples demonstrate that the written instructions and visual information were sometimes inseparable. The diagrams were not simply decorative additions to an otherwise complete mathematical explanation; they could contain information that the text left unstated.
Kelly identifies three principal functions for these illustrations: they provided a space in which to work through calculations, helped scribes remember information and allowed them to check their results.
To explain how this worked, he compares the ancient papyri with modern British examination questions involving geometric diagrams. Students often obtain measurements directly from an illustration before applying them to a calculation. Roman Egyptian scribes used their drawings in a comparable way, although their diagrams frequently went further by displaying the answers alongside the original measurements.
By bringing the figures, instructions and results together, these documents allowed readers to follow the method from beginning to end. They could see how the calculation worked and apply the same procedure to a problem with different values. Kelly suggests that this approach gives some of the exercises a quality resembling mathematical proofs.
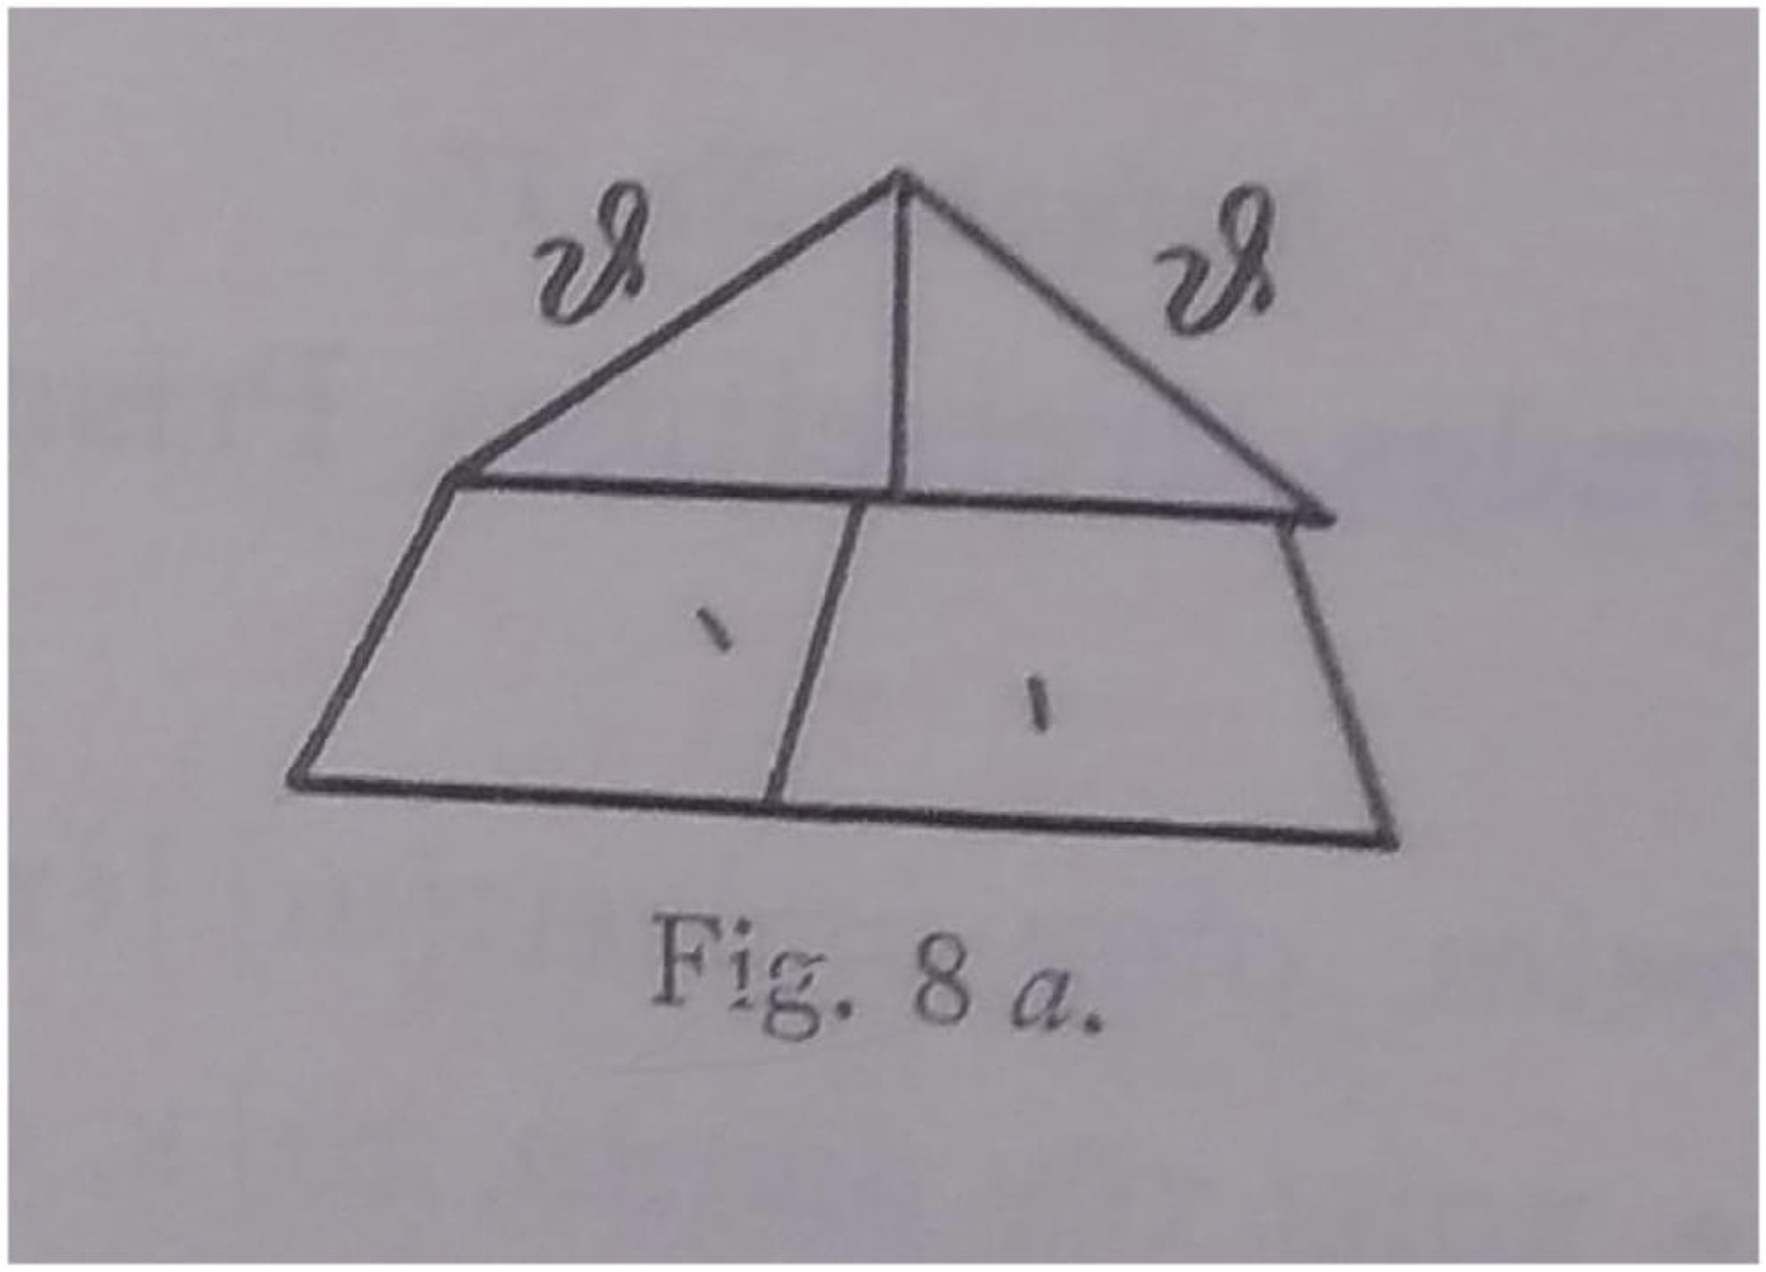
Photo Credit: Kelly, T., Historia Mathematica (2026)
The study also highlights how earlier editions could alter our understanding of ancient mathematical documents. One example comes from a Vienna papyrus containing a problem involving the volume of a square-based pyramid. When the document was published in 1932, its editors, Gerstinger and Vogel, reproduced the illustration as a neat, flat geometric shape.
However, Kelly's examination of the original papyrus revealed a rougher drawing positioned at an angle, with the shape represented in a way that conveyed depth. The earlier version had effectively removed a feature of the original illustration that could help explain how the scribe approached the problem.
This difference demonstrates why the appearance and arrangement of ancient diagrams deserve closer attention. Even seemingly minor editorial changes can obscure how people originally recorded and understood mathematical information.
By assembling these drawings into a single catalogue, Kelly provides researchers with a resource for studying the relationship between written instructions, numerical calculations and visual representations in Roman Egypt. The evidence suggests that these scribes did not treat diagrams as optional illustrations. Instead, they formed an important part of the mathematical process, helping turn written problems into practical, step-by-step solutions.